In this blog post, we’ll dive into the fundamental transformations you can perform using the Power Query editor. Whether you’re a seasoned data analyst or just getting started, these tips and techniques will empower you to wrangle your data with ease and precision.
Before we take a closer look at some basic transformations I want to highlight two functionalities within the Power Query editor.
Tip 1: Activate data profiling tools
In addition to its robust transformation capabilities, Power Query empowers data analysts with powerful data profiling tools to gain deeper insights into their datasets. With just a few clicks, you can leverage these tools to comprehensively understand your data’s structure, distribution, and quality. From basic statistics like count, min, max, and average to more advanced insights such as data distribution histograms and data type summaries, the data profiling features in Power Query offer a holistic view of your data at a glance. By harnessing these tools, you can quickly identify patterns, anomalies, and potential issues, laying the groundwork for informed data transformations and insightful analyses.
To activate column statistics:
- Navigate to the View tab in the Power Query editor.
- Check the “Column quality”, “Column distribution” and “Column profile” option.

Column quality provides a quick assessment of data quality by highlighting potential issues such as missing values, errors, or inconsistencies within a column.
Column distribution offers a visual representation of the distribution of values within a column, helping users understand the range, frequency, and patterns of data distribution.
Column profile offers a holistic overview of a column’s characteristics, including data type, count of distinct values, and basic statistics like minimum, maximum, and average values.
Important note:
By default, Power Query conducts data profiling on the initial 1,000 rows of your dataset. To extend this analysis to encompass the entirety of your data, opt for the “Column profiling based on top 1000 rows” message located in the lower-left corner of your editor window. Then, select “Column profiling based on entire data set” to ensure comprehensive column profiling across all data entries.
Tip 2: Comment Your Steps in the Advanced Editor
As you craft intricate data transformations in the Power Query editor, clarity and documentation become paramount. Don’t overlook the importance of commenting your steps, especially when utilizing the advanced editor. By adding comments to your M code, you not only enhance readability but also facilitate collaboration and troubleshooting down the line.
To comment your steps in the advanced editor:
- Open the advanced editor from the Home tab.
- Precede your comments with “//” to annotate each step.


Once you have written your comments the commented step will receive an “i” symbol in the applied steps section on the right side of the screen. By hovering over the “i” symbol you will see the comment.
With clear and concise comments guiding your transformations, you’ll streamline your workflow and empower others to understand and build upon your analyses.
Essential Transformations
1. Renaming Columns and Tables
Easily clarify and standardize your data by renaming columns and tables to better reflect their contents and purpose. In the Power Query editor, either simply right-click on a column or table and select “Rename” to make your adjustments or double-click on the table/column name.
Best practices:
- Choose a name that concisely describes the content of the column or table.
- Choose an identifier case and stick with it. Suitable identifier cases are Camel Case (myTable) or snake case (my_table) for example.
2. Changing Data Types
Ensure consistency and accuracy by changing the data types for columns where needed. With Power Query, you can effortlessly convert your columns to date, date/time, text or several number formats to suit your analytical needs.
To do so either right-click on the column and select “Change Type” or navigate to the “Transform tab” where you will be able to select the correct data type.

Alternatively you can also select “Detect Data Type”. Power BI will then detect the data type of the selected columns based on the first 1000 rows. Be sure to check that the detected data type is the correct one.
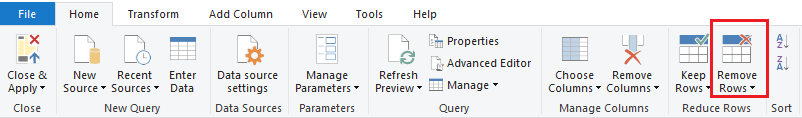
3. Removing Rows
If you import data from an Excel Workbook it is often the case that the first few rows do not contain data needed for the analysis. This could be the case if you have added a description of the data in your excel workbook for example.
To remove certain rows navigate to the home tab and then select “Remove Rows”. You then have the possibility to either remove a certain number of rows from the top or the bottom of your table.
By mastering these essential transformations in the Power Query editor, you’ll start your journey of getting your data ready for analysis. Stay tuned for more tips and tricks to elevate your data analysis skills!