In Microsoft Power BI, relationships between tables are fundamental to creating a robust and insightful data model. They enable you to build a coherent structure that ensures your reports and dashboards accurately reflect the underlying data. This post will provide a detailed overview of relationships in Power BI, covering how to create them, understanding different cardinalities, cross-filter directions, and how and when to deactivate a relationship.
Creating Relationships
Power BI allows you to create relationships between tables to define how data in one table relates to data in another. Here’s a step-by-step guide to creating relationships:
Automatic Relationships
When you load tables into Power BI, it often automatically detects and creates relationships based on the column names and data types. It is always important to review the automatically created relationships. Suppose we have two tables (“Product” & “Distributor”) and each of the table contains a column called “id”. The “id” in the Product table reflects the product id and the “id” in the Distributor table reflects the distributor id. Power BI now might automatically create a relationship between these two tables based on the id columns, which obviously does not make sense. To make sure that all automatically created relationships are correct navigate to the “Model” view and review each relationship.
Manual Relationships
In most cases Power BI won’t be able to accurately detect all relationships within your data. In these cases you have to create them manually.
- Go to the “Model” view by selecting the model icon on the left sidebar.
- Drag and drop the field from one table to the corresponding field in another table to create a relationship manually.
- Alternatively, select “Manage Relationships” from the Home tab, then click on “New” to define the relationship manually.


In the example above we created a relationship between the “flights” table and the “airlines” table based on the columns “AIRLINE” (flights) and “IATA_CODE” (airlines).
The relationship will now also be shown in the model view. By clicking on the connection between two tables we can edit existing relationships.
Cardinalities
Cardinality defines the numerical relationship between rows of one table and rows in another. There are three types of cardinality in Power BI:
One-to-one (1:1)
- Each row in Table A has only one corresponding row in Table B, and vice versa.
- Example: Each employee has exactly one address.
One-to-Many (1:*) or Many-to-One (*:1)
- A single row in Table A can have multiple corresponding rows in Table B, but each row in Table B corresponds to only one row in Table A.
- Example: Each customer can place multiple orders, but each order is placed by only one customer.
Many-to-Many (*:*):
- Rows in Table A can have multiple corresponding rows in Table B and vice versa.
- Example: Products can be associated with multiple categories, and categories can contain multiple products.
In the new relationship we created above we see, that the relationship has a cardinality of many-to-one. This means that each flight is operated by one airline, but one airline can operate many flights.
Cross-filter direction:
The cross-filter direction controls how filters are applied between tables in a relationship. There are two different kinds of directions.
Single:
- The filter context is applied in one direction only. If you filter Table A, it affects Table B but not vice versa.
- This is the default setting for one-to-many relationships.
Both:
- The filter context is applied in both directions. Filtering Table A will affect Table B and vice versa.
- This is useful for many-to-many relationships or when you need to perform complex calculations across multiple tables.
You can see the cross-filter direction from the model view directly.
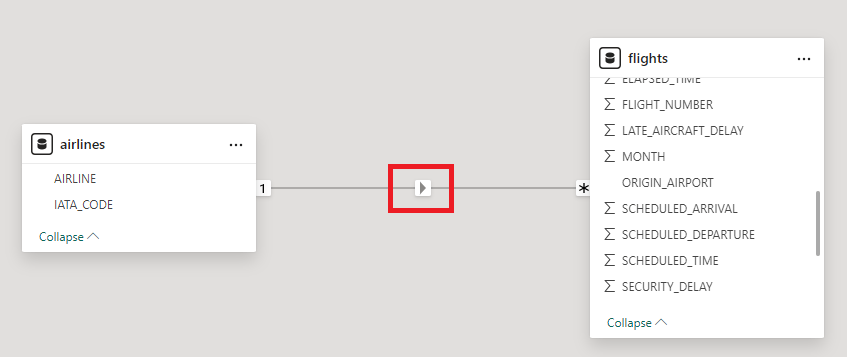
As the arrow only shows from the airlines table to the flights table we can see that we have a single direction cross-filter. If we filter the table “airlines” it will affect the “flights” table but not the other way around. The cross-filter direction can be manually overwritten (if needed) by editing the relationship.
Conclusion
Understanding relationships in Power BI is crucial for building effective data models. By mastering how to create relationships, understanding cardinality, and setting cross-filter directions, you can ensure your reports and dashboards are both accurate and insightful. This foundational knowledge will empower you to leverage the full capabilities of Power BI in your data analytics and engineering projects.